🚀 Introduction
Tracking link performance is essential for understanding what works in your marketing campaigns. With the 9to.in dashboard, you get powerful analytics to monitor clicks, user behavior, devices, and geographic data—all in real-time.
This guide will help you understand and use the analytics dashboard effectively.
📊 Where to Find Analytics
To access analytics:
Go to the left sidebar
Click on 👉 Analytics
You will see a dashboard like this:
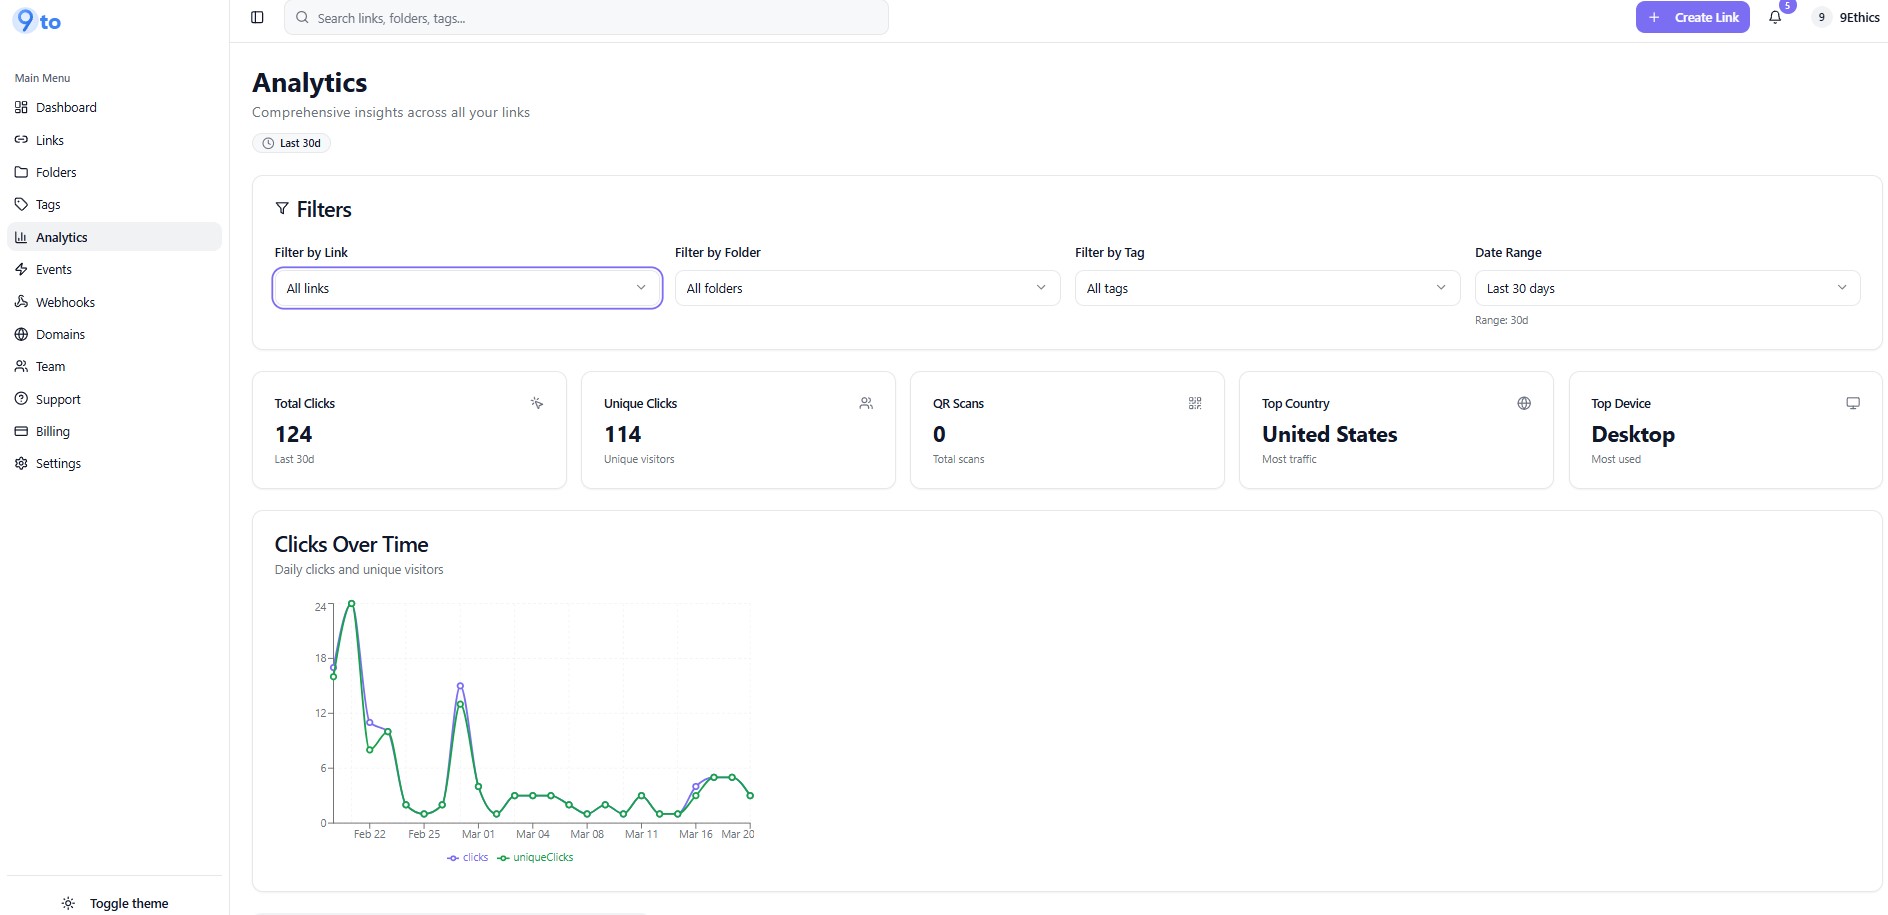
⚙️ Filter Your Data
At the top of the analytics dashboard, you can apply filters:
Filter by Link – View data for a specific link
Filter by Folder – Analyze grouped links
Filter by Tags – Track campaigns using tags
Date Range – Select time period (e.g., last 30 days)
👉 This helps you focus on specific campaigns or timeframes.
📈 Key Metrics Overview
You’ll see important performance metrics:
Total Clicks – Total number of clicks on your links
Unique Clicks – Number of individual users
QR Scans – Number of QR code scans
Top Country – Location with highest traffic
Top Device – Most used device type
These give you a quick snapshot of performance.
📉 Clicks Over Time
The Clicks Over Time graph shows:
Daily clicks
Trends over time
Campaign performance patterns
👉 Use this to identify:
Peak traffic days
Campaign success trends
Sudden drops or spikes
🌍 Geographic Analytics
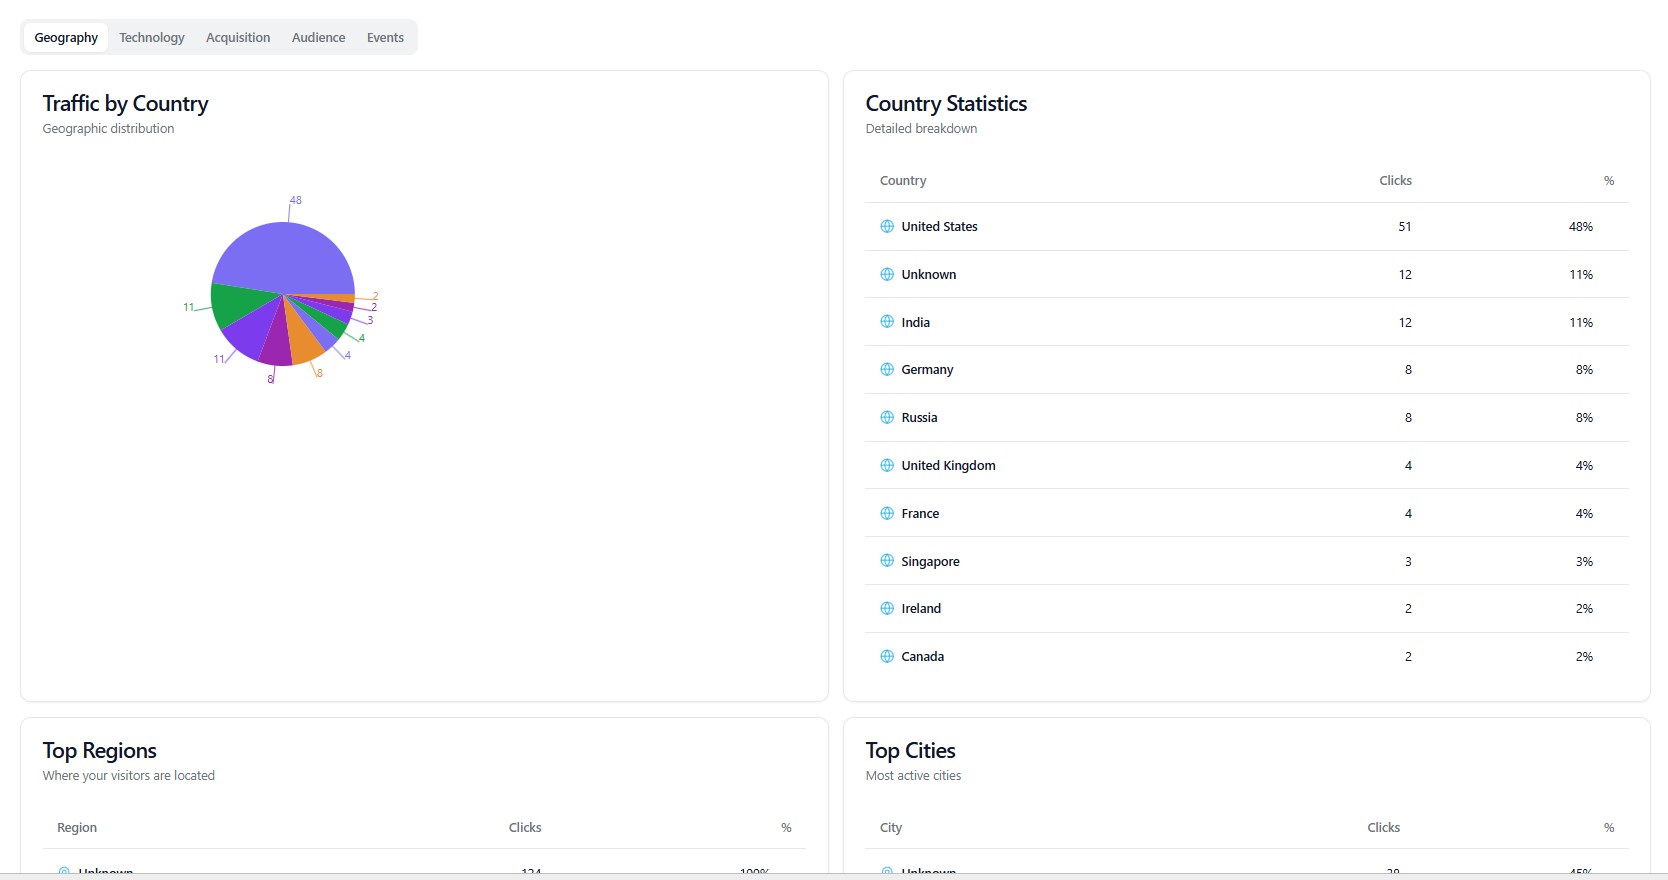
Understand where your users are coming from:
Traffic by Country (visual chart)
Country Statistics (detailed breakdown)
Top Regions & Cities
👉 Helps you:
Optimize campaigns by region
Identify high-performing markets
Plan geo-targeted strategies
💻 Technology Insights
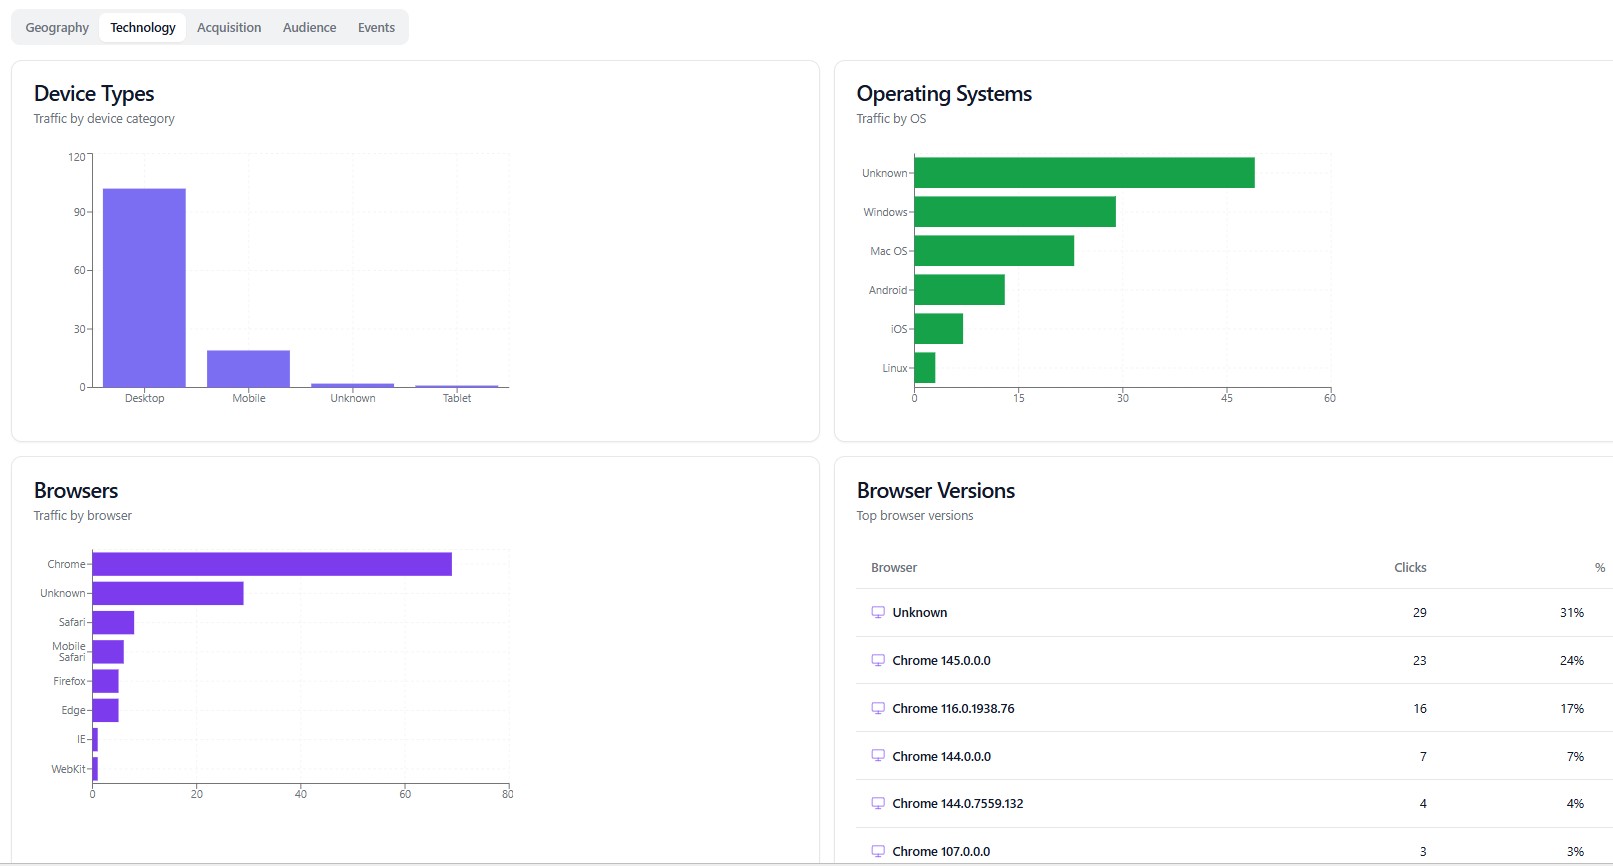
See how users access your links:
Device Types
Desktop
Mobile
Tablet
Operating Systems
Windows, macOS, Android, iOS
Browsers
Chrome, Safari, Firefox, etc.
👉 Useful for:
Device-based optimization
UX improvements
Platform-specific campaigns
🧾 Event Tracking (Real-Time Logs)
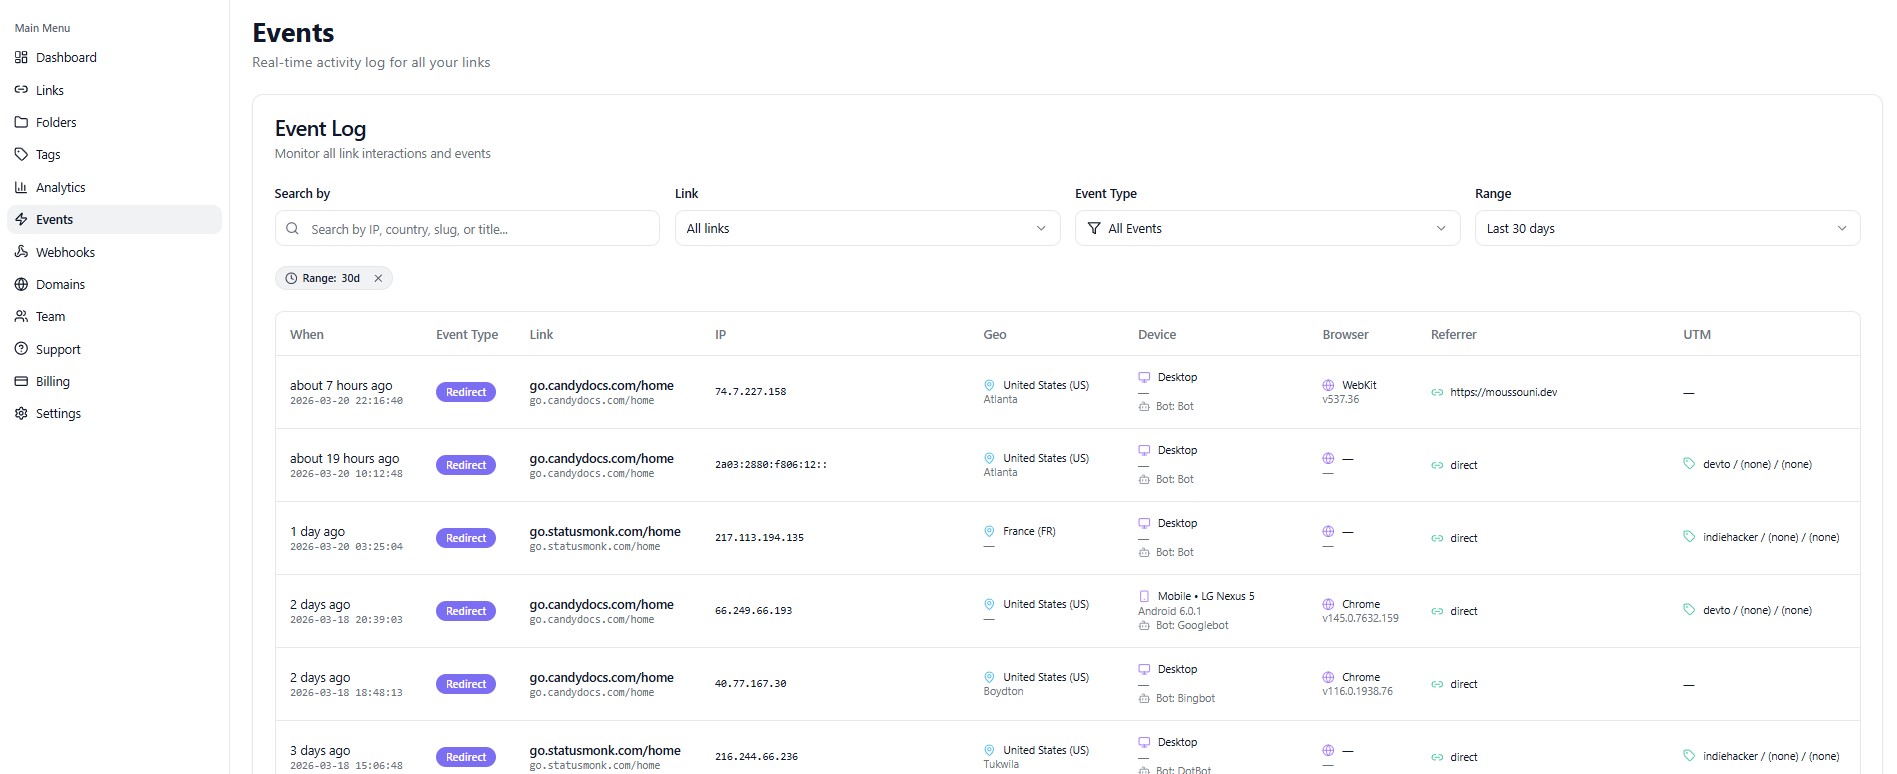
The Events section shows detailed logs of every interaction:
Timestamp of click
Link accessed
IP address
Location (Geo)
Device and browser
Referrer (source of traffic)
UTM parameters
👉 This is useful for:
Real-time monitoring
Debugging campaigns
Deep-level analysis
🎯 How to Use Analytics Effectively
Use insights to:
📊 Measure campaign performance
🎯 Optimize targeting strategies
📱 Improve device-specific experiences
🌍 Focus on high-performing regions
🧪 Improve A/B test results
💡 Best Practices
✅ Regularly check analytics dashboard
✅ Use filters to analyze specific campaigns
✅ Combine analytics with UTM tracking
✅ Monitor trends over time
✅ Use insights to optimize future campaigns
❌ Common Mistakes to Avoid
❌ Ignoring analytics data
❌ Not using filters effectively
❌ Tracking without clear goals
❌ Overlooking geographic insights
🔥 Pro Tips
Combine analytics with:
🎯 Geo targeting
📱 Device targeting
🧪 A/B testing
Use analytics to:
Increase conversions
Reduce bounce rates
Improve ROI
🏁 Conclusion
The 9to analytics dashboard gives you everything you need to track, analyze, and optimize your links. With real-time insights and detailed breakdowns, you can make smarter marketing decisions and maximize your results.
Start using analytics to turn every click into actionable insights 📊🚀